
Edge Observability: What It Is and Why Your Branch Sites Are Blind Spots
Edge observability is the ability to understand what’s happening inside the distributed parts of your network (branch offices, campuses, remote sites, and field equipment) from the metrics, logs, and traces those systems produce, without having to send someone on-site to find out.
That one-paragraph version is the answer most people are searching for. The rest of this guide is for the people who just realized their organization has twelve sites, one IT team, and no good answer to the question “why is the network slow in Building C?”
Monitoring Tells You Something Broke. Observability Tells You Why.
Traditional monitoring works from a list of known failure modes: ping the router, alert if CPU crosses 90 percent, page someone when the circuit drops. It answers questions you thought to ask in advance.
Observability inverts that. Instead of pre-defining every alarm, your systems continuously emit telemetry, detailed operational data, and your platform lets you ask new questions after something strange happens. Why did point-of-sale transactions slow down at 2 p.m.? Which sites saw the same DNS pattern? Is this a circuit problem, a Wi-Fi problem, or an application problem?
For a single data center, that distinction is useful. For an organization with sites spread across three counties, it’s the difference between a ten-minute answer and a truck roll.
Why the Edge Breaks Traditional Monitoring
Everything about observability gets harder the moment your infrastructure leaves the data center. Five things do the breaking.
1. There’s no one standing next to the equipment. A school district with 14 campuses or a city with 20 facilities can’t station an engineer at each one. When the only diagnostic tool is “drive there and look,” a 20-minute problem becomes a half-day outage.
2. The links are the weak point, and the blind spot. Branch sites ride on carrier circuits, fiber, fixed wireless, and last-mile connections you don’t fully control. When monitoring traffic rides the same link that just failed, your visibility dies exactly when you need it. Observability at the edge has to survive the failure of the thing it’s observing.
3. Bandwidth budgets are real. Streaming every log line from every branch back to headquarters can eat a meaningful share of a small site’s circuit. Edge observability designs filter, sample, and summarize at the site, sending back what matters instead of everything.
4. Tool sprawl hides the answer. The firewall has a dashboard. The switches have a dashboard. The Wi-Fi has a dashboard. The carrier has a portal. When a user says “it’s slow,” the answer lives across four screens that don’t agree with each other. Distributed environments multiply this by every site.
5. Security lives at the edge too. Branches are where unmanaged devices show up, where shadow IT plugs in, and where attackers probe first. The same telemetry that explains a slowdown is often what surfaces an intrusion, which is why observability and security architecture increasingly share a data pipeline.
The Three Signals, and What Changes at the Edge
The industry calls metrics, logs, and traces the three pillars of observability. All three still apply at the edge, but each one changes character.
Metrics (the numbers: latency, loss, utilization, signal strength) are cheap to collect and cheap to ship, which makes them the workhorse of edge visibility. The change: you need them per site and per link, not just in aggregate. An average across 15 sites will happily hide one drowning branch.
Logs (the events: config changes, auth failures, interface flaps) are where root causes live. They are also where bandwidth dies. The change: at the edge, logs get filtered and buffered locally, usually by a small local collector rather than the devices themselves, then shipped selectively. A site that loses its uplink should hold its logs and forward them when the link returns, not lose the evidence.
Traces (the request paths: how a transaction moved through your systems) matter most where cloud applications meet branch users. One honest caveat: traces only cover the systems you can instrument. The interesting slowdown at the edge usually crosses boundaries you don’t own (your site, the carrier, the SaaS provider), and attributing delay to those segments takes active path measurement, synthetic tests and hop-by-hop probes, working alongside your traces. The goal is the same either way: knowing which segment added the delay, so you escalate to the right party with proof instead of opinions.
Open standards have steadily lowered the barrier here. For the applications you own, OpenTelemetry means telemetry is no longer locked to whichever vendor’s agent you installed first. For the network gear itself, the standards that matter are streaming telemetry, flow records, and structured logs rather than closed agents, and support for them belongs on your evaluation checklist.
What Good Edge Observability Looks Like
Vendor-neutral principles we design around, regardless of whose logo ends up on the boxes.
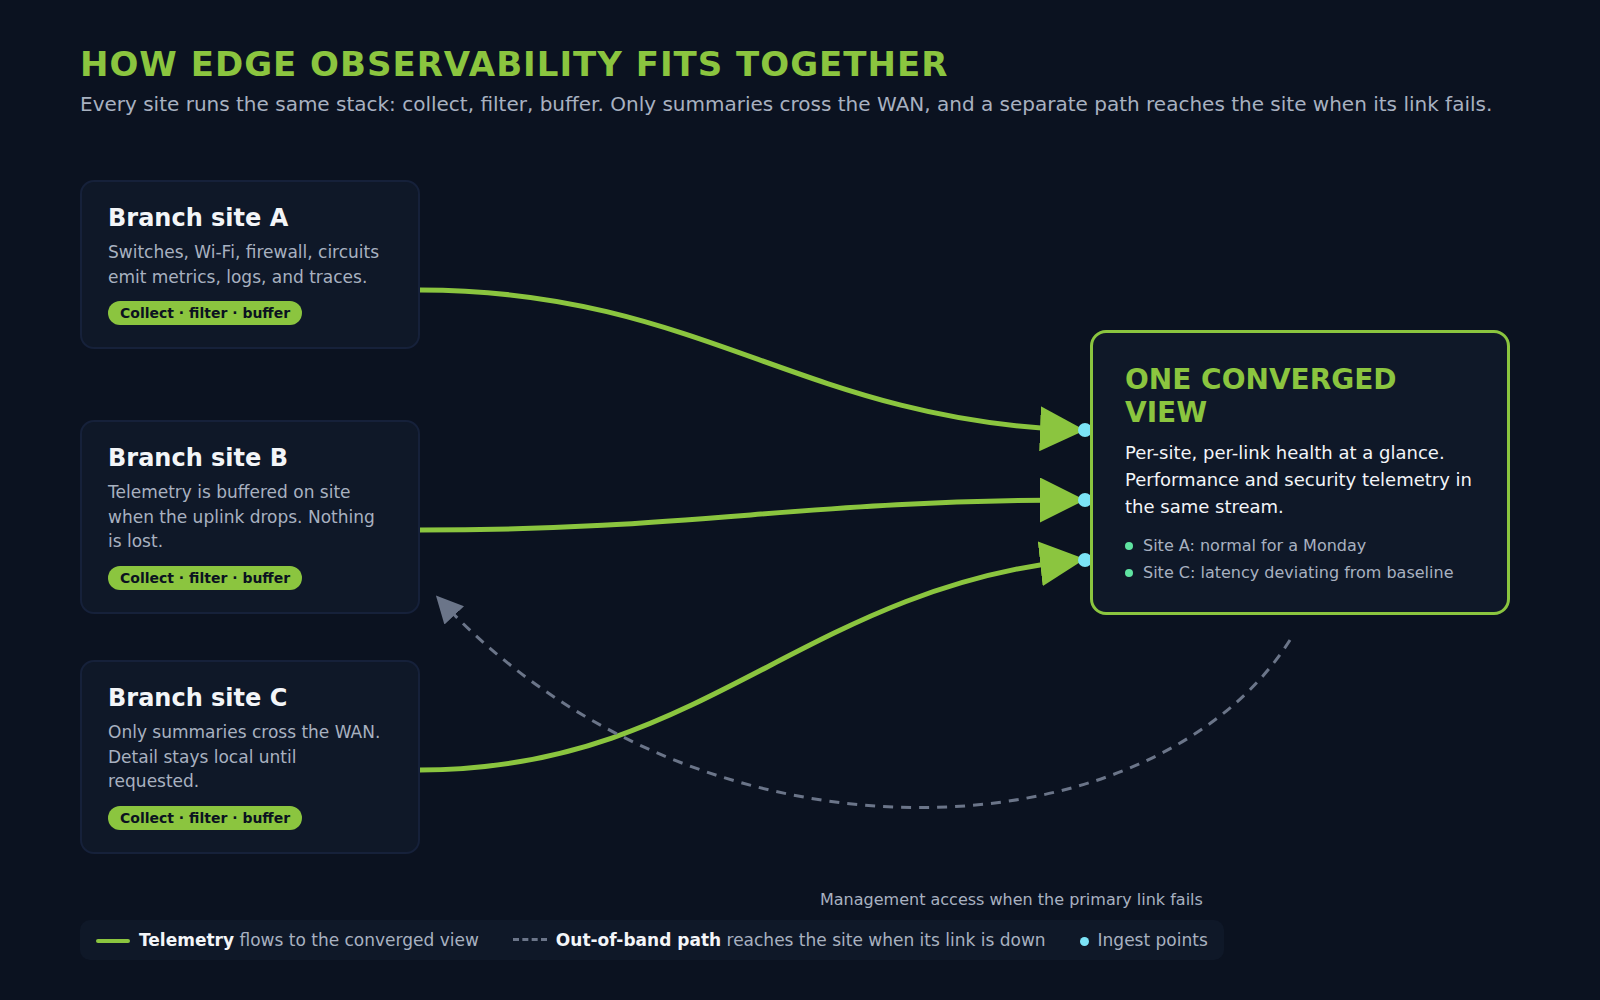
Collect locally, decide locally, summarize upward. Each site gathers its own telemetry and applies filtering before anything crosses the WAN. Headquarters sees the summary and can pull detail on demand.
One pane, not eleven. Whatever the mix of switching, wireless, security, and circuits, the telemetry converges into a single view where a per-site health picture exists at a glance. This is a design decision, not a product feature. It has to be scoped before purchasing, which is exactly the step that gets skipped when tools are bought one incident at a time.
Visibility that survives the outage. Out-of-band access (a cellular path or a secondary circuit) plus local buffering means that when the primary link fails, you can still reach the site, and the evidence is still there when the link returns. The worst time to discover your monitoring rides the failed circuit is during the failure.
Baselines before alarms. A couple of weeks of honest baseline data at minimum, longer where the site’s rhythm runs monthly (“Building C always looks like this on Mondays”), prevents the alert fatigue that makes teams ignore the one page that matters. Alert on deviation from the site’s own normal, not on generic thresholds.
Security telemetry in the same stream. Auth failures, new-device events, and traffic anomalies belong in the same pipeline as performance data, because at a branch, “it’s slow” and “we’re being scanned” look identical until you can see both.
Who Actually Needs This
The pattern fits any organization where sites outnumber engineers.
School districts. Every campus is a branch, instruction now depends on connectivity, and the IT team is small and central.
Local government. City halls, public safety, utilities, and libraries on a patchwork of circuits and eras of equipment.
Healthcare networks. Clinics where downtime isn’t an inconvenience, and where compliance requires knowing what happened.
Regional ISPs and co-ops. The edge is the product. Per-segment visibility is the difference between proactive fixes and churn.
Multi-site businesses. Retail, logistics, manufacturing: anywhere revenue flows through a branch link.
If that list sounds like our customer base, it’s not a coincidence. This is the network design and infrastructure work we do daily across Texas, and observability is increasingly the first conversation, not the last.
Seven Questions to Ask Before You Buy
Worth asking before any purchase, ours included.
- Can I see per-site, per-link health in one view? If the answer involves the phrase “integration roadmap,” keep asking.
- What happens to visibility when a site’s primary link fails?
- How much WAN bandwidth does telemetry consume at my smallest site?
- Does it speak open standards (OpenTelemetry, streaming telemetry), or am I marrying an agent?
- Can security events and performance data be correlated, or do they live in separate tools?
- What does it cost at 5 sites, and at 50? Per-device pricing that’s fine today can ambush a growing organization.
- Who watches it? Tooling without ownership becomes shelfware. Decide up front whether this is staffed internally, co-managed, or managed.
Where EdgeTeam Fits
Edge observability isn’t a product you buy. It’s a property your network either has or doesn’t: the ability to answer “what’s happening at that site, and why?” without driving there. Multi-site organizations get it by design. Local collection, efficient transport, one converged view, and visibility that outlives an outage. That design work is engineering, not procurement, which is how we approach every project.
Running a multi-site network with a small team? Tell us what you’re working on. A real engineer will read it, and we’ll tell you what we’d actually do, including when the answer is “you don’t need to buy anything.”
Related reading from The IT Edge: When’s the last time you thought about network management?
Frequently Asked Questions
What is edge observability?
Edge observability is the ability to understand the internal state of distributed infrastructure (branch offices, campuses, remote sites) from the metrics, logs, and traces it produces, without needing on-site staff to diagnose problems.
What’s the difference between observability and monitoring?
Monitoring checks for failure conditions you defined in advance. Observability collects rich telemetry so you can investigate problems you didn’t predict, asking new questions of the data after something unexpected happens.
What are the three pillars of observability?
Metrics (numeric measurements like latency and utilization), logs (recorded events), and traces (the path a request takes through systems). At the edge, all three require local collection and bandwidth-aware transport.
Why is observability harder at the edge than in a data center?
Edge sites have limited bandwidth, links you don’t control, no on-site IT staff, and telemetry that can vanish exactly when the site fails. Edge observability designs around those constraints. Data-center tooling usually doesn’t.
Do small organizations need edge observability?
Size matters less than site count. A 200-person district with 14 campuses has a harder visibility problem than a 2,000-person company in one building. If sites outnumber engineers, the answer is probably yes.